
Excellent Graphs
By: Carly Cantrell
Can you construct a graph of any function y = f(x) by generating a table of values with the x values in
one column and the y values in another? OH YEAH!
The run-down on making excellent graphs:
Creating the domain and range:
1. In the first column-first row, A1, write x. In the
second column-first row, B2, type y.
2. The “x”
column becomes the domain of the function. To quickly generate the domain,
enter the first number in A2 and the second number in A3. Then highlight the
two cells and once you get the black cross you can pull down to fill as many
entries as you desire.
3. The “y”
column becomes the outputs.
4. To enter the desired function, click B2. Then “= f(x)”
5. NOTICE
where an ‘x’ variable would go you must type A2.
6. Then you can drag the B2 cell down to however many
entries there are.
Now you have all the data for
y = f(x).
To make the actual graph:
1. Highlight all the data
2. Insert à
Chart à Scatter à
Smooth Lined
Here are some examples of
functions and their graphs made in excel:
y = 2x
interval:
(1,20)
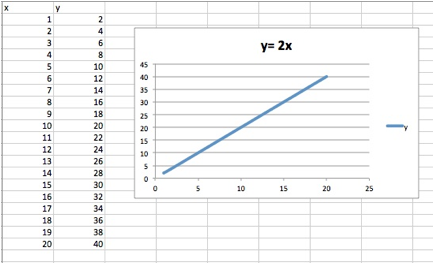
Excel produced a linear graph with a slope of 2 just
as it should have.
y = 3x +
2
interval:
(0,20)
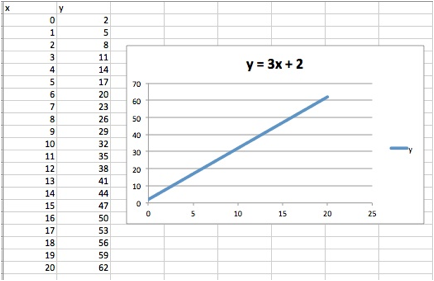
Excel produced the appropriate linear graph with a slope of
3 and a y-intercept at 2.
y = x2
interval:
(1,20)
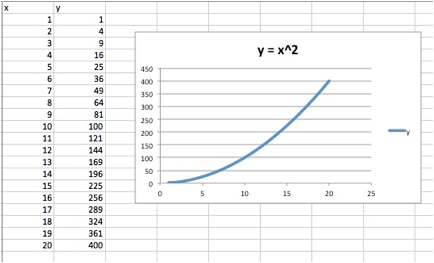
Excel produced the correct quadratic function.
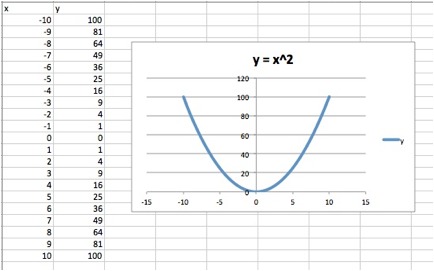
y = x2
interval:
(-10,10)
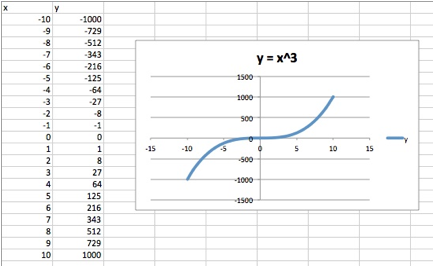
y = x3
interval:
(-10,10)
y =
sin(x)
interval:
(1,20)
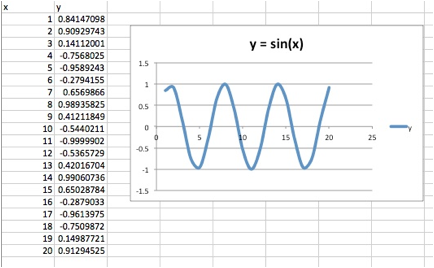
Excel is even capable of determining and graphing
trigonometry functions.